# Usage
While older versions (< 4.0) of NanoR (opens new window) included functions to retrieve informations directly from basecalled FAST5 (opens new window) files, in the current version (4.0) these are dismimissed as they were quite slow and resource-intensive. Since release 4.0, NanoR solely requires a sequencing summary file to generate a complete overview of a sequencing run. Checking the pore status of a flow cell can also be done using the mux scan data file created by MinkNOW. A minimal working example illustrating NanoR functions and their output is provided below.
# Use cases
NanoR (opens new window) repository includes a data folder with a couple of sequencing summary files (randomly downsampled) and a mux scan data file. This can be downloaded for testing.
cd ~
mkdir nanortest && cd nanortest
wget https://raw.githubusercontent.com/davidebolo1993/NanoR/master/data/sample_summary_1.tsv
wget https://raw.githubusercontent.com/davidebolo1993/NanoR/master/data/sample_summary_2.tsv
wget https://raw.githubusercontent.com/davidebolo1993/NanoR/master/data/sample_mux.csv
cd ..
First off, we can summarize run statistics in a tab-delimited file using the report (opens new window) function.
library(NanoR)

#test files
summary1<-file.path("~/nanortest/sample_summary_1.tsv")
summary2<-file.path("~/nanortest/sample_summary_2.tsv")
muxdata<-file.path("~/nanortest/sample_mux.csv")
alfreddata<-file.path("~/nanortest/sample_alfred_qc.tsv")

#out file
out1<-file.path("~/nanortest/report_1.NanoR.tsv")

#run report function
NanoR::report(summary=summary1, out=out1) #or report(summary=summary1, out=out1)
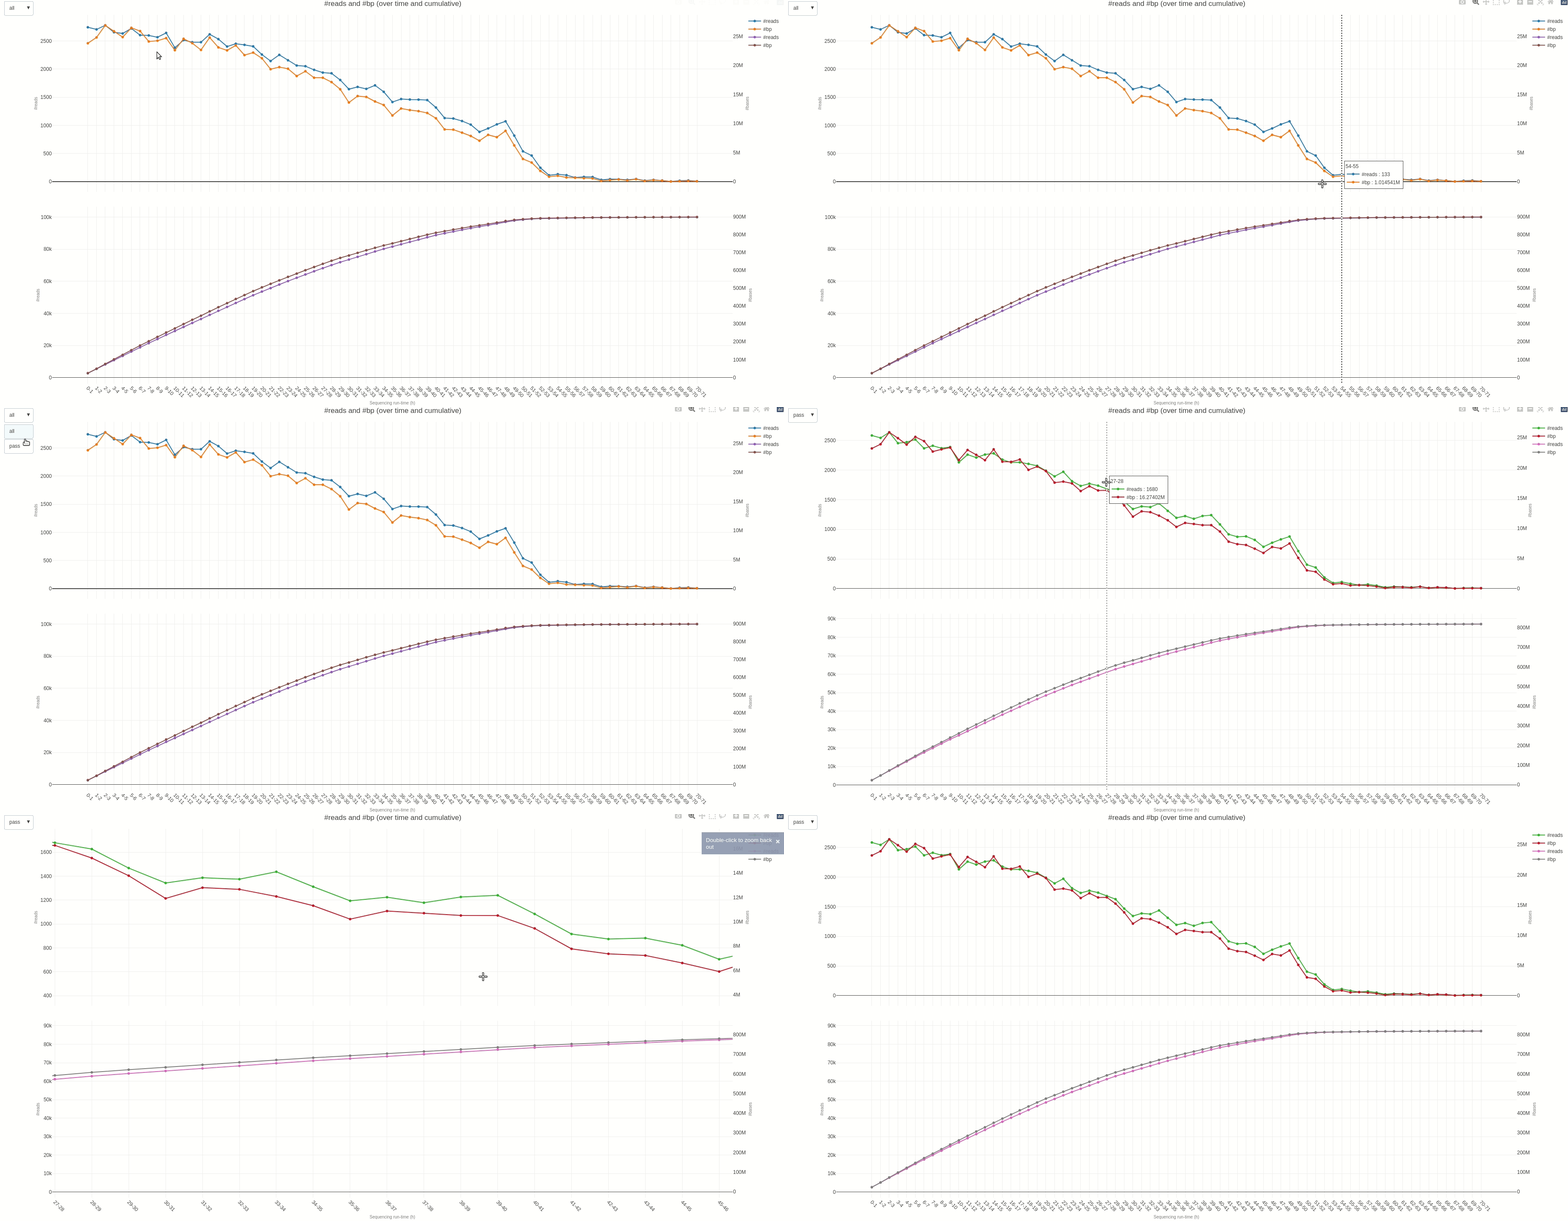
The output TSV file contains several statistics on reads length and quality as well as informations on sequencing throughput. A deeper dive into the sequencing yield (calculated every hour) can be achieved using the yield (opens new window) function.
#out file
out2<-file.path("~/nanortest/yield_1.NanoR.html")

#run yield function
NanoR::yield(summary=summary1, time=1, out=out2) #time can be adjusted to different hour fractions
The output HTML file looks like the one below.
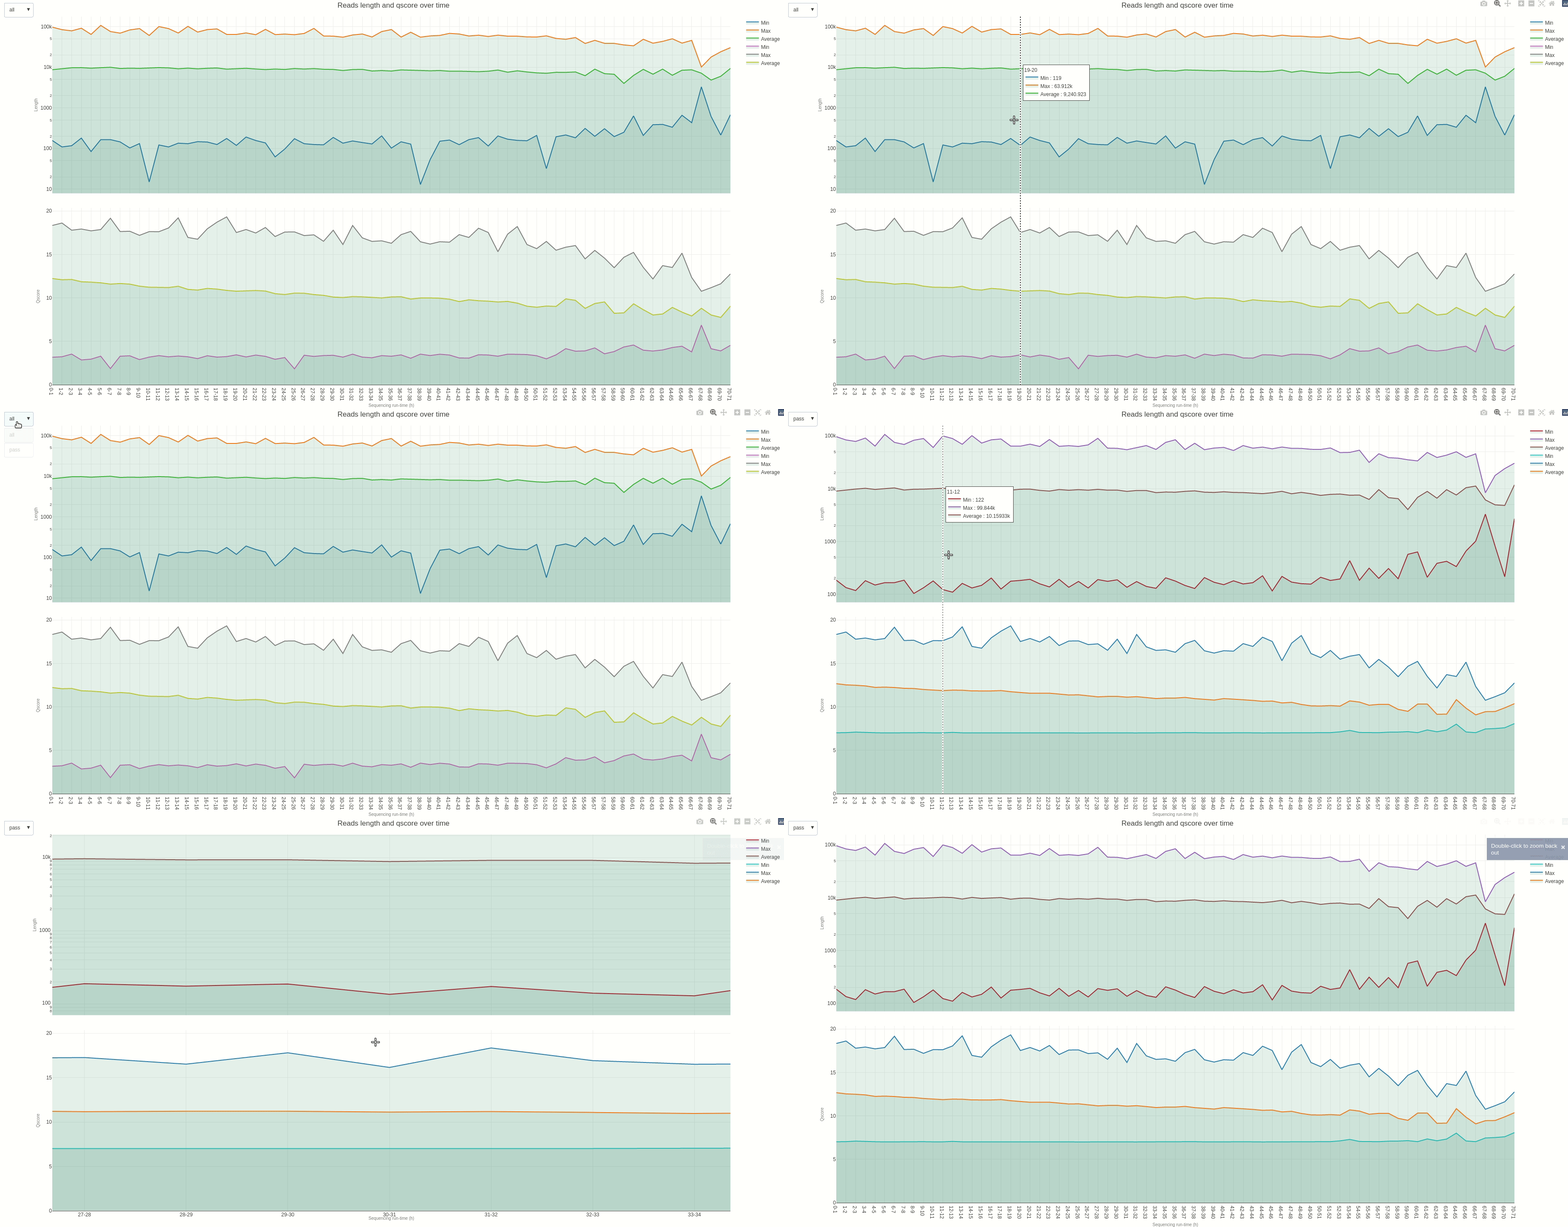
Similarly, reads length and quality can be monitored over time using the lenqual (opens new window) function.
#out file
out3<-file.path("~/nanortest/lenqual_1.NanoR.html")

#run lenqual function
NanoR::lenqual(summary=summary1, time=1, out=out3) #time can be adjusted to different hour fractions
The output HTML file looks like the one below.
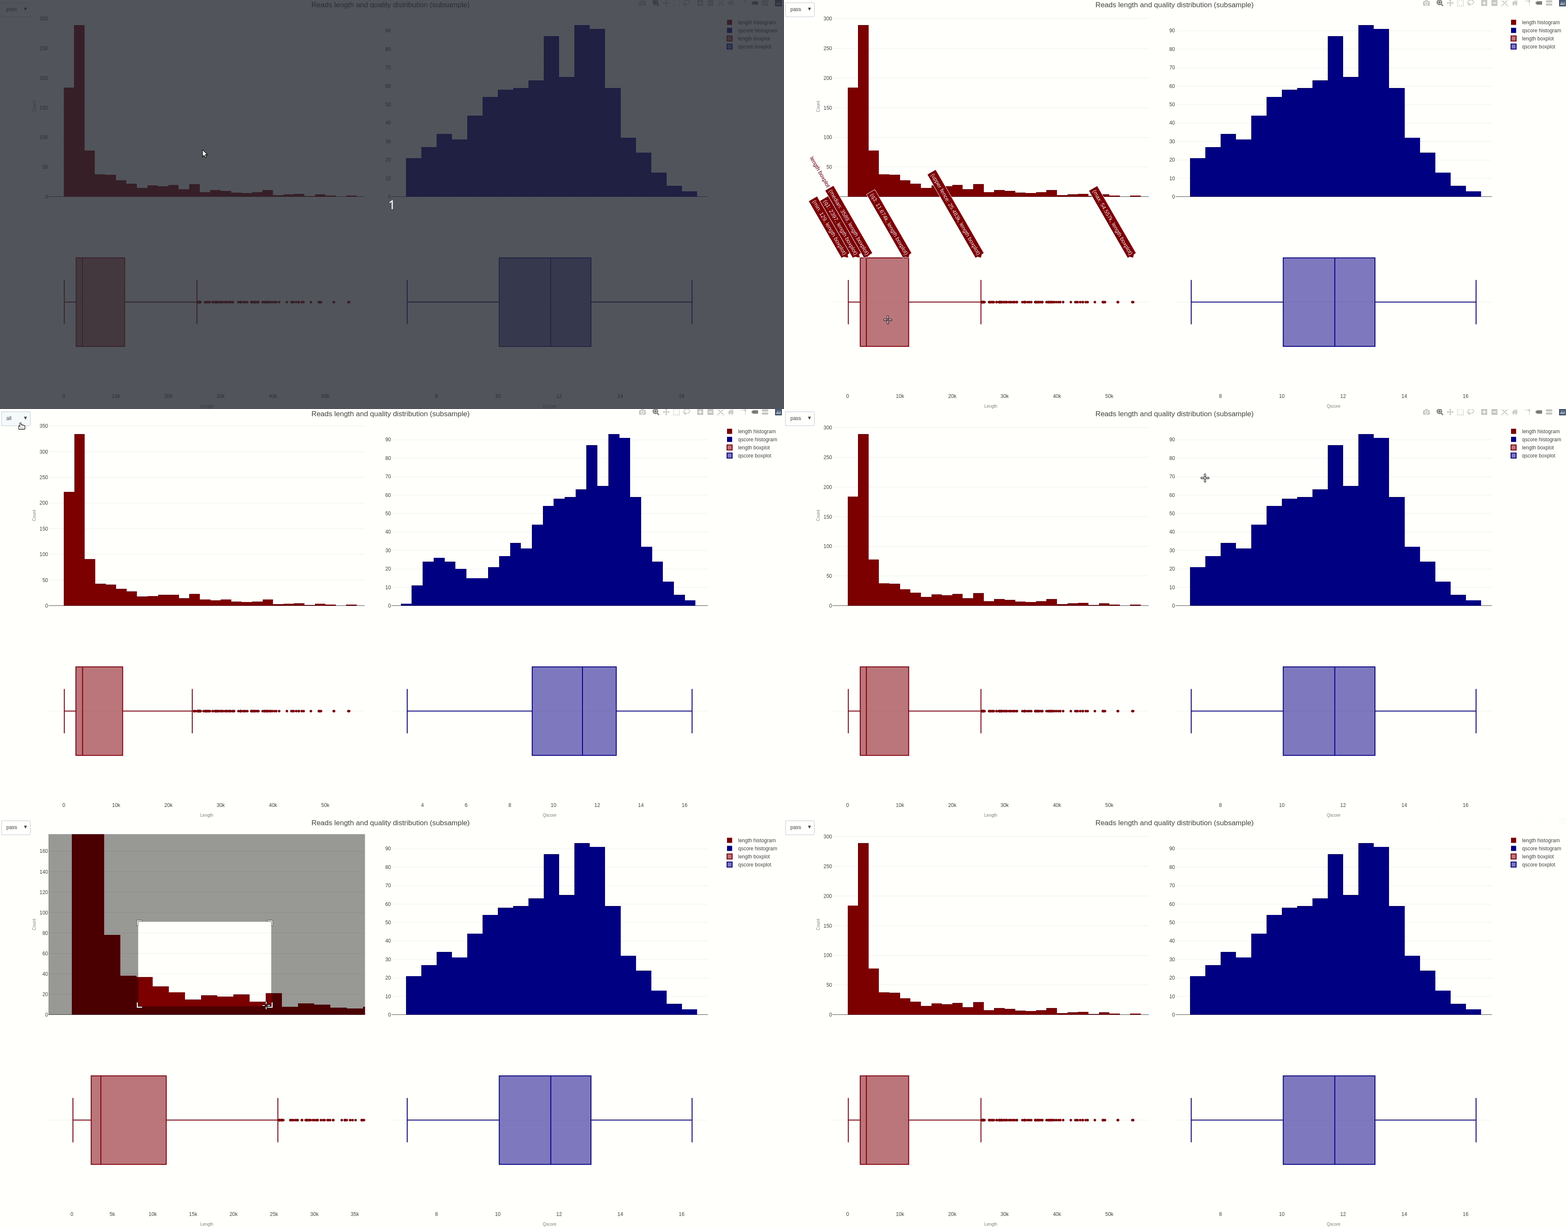
The distribution of reads length and quality for a sample of the sequences can be further calculated with the lenqualdist (opens new window) function.
#out file
out4<-file.path("~/nanortest/lenqualdist_1.NanoR.html")

#run lenqualdist function
NanoR::lenqualdist(summary=summary1, fraction=0.01, out=out4) #fraction can be adjusted to different values
The output HTML file looks like the one below.
The activity of the channels in the sequencing flow cell and over time can be also visually inspected using the heatmap (opens new window) function.
#out file
out5<-file.path("~/nanortest/heatmap_1.NanoR.html")

#run heatmap function
NanoR::heatmap(summary=summary1, time=1, out=out5) #time can be adjusted to different hour fractions

#use the following if plotting PromethION data
#NanoR::heatmap(summary=summary1, time=1, out=out5, platform = "promethion")
The output HTML file looks like the one below.
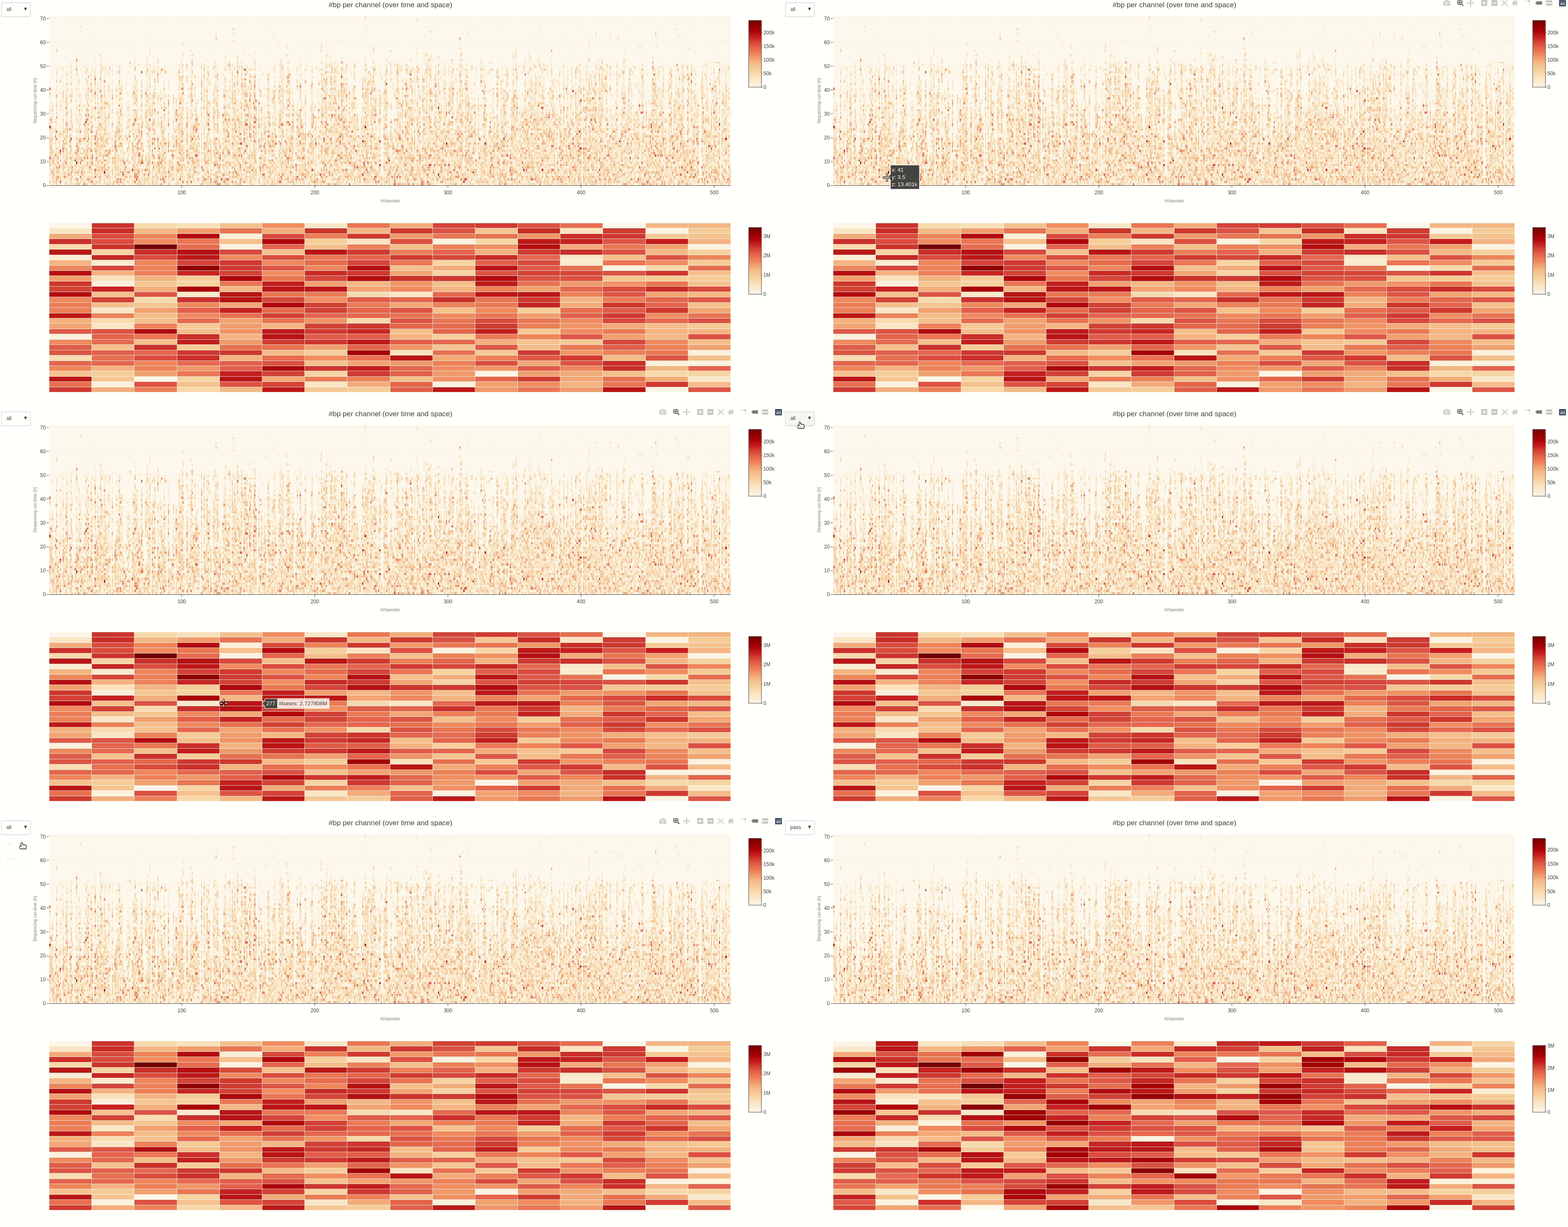
Having the mux scan data file at hand, the status of the sequencing pores trough the different muxes (the time between different muxes is 1.5 hours, by default) can be inspected using the muxscan (opens new window) function.
#out file
out6<-file.path("~/nanortest/muxscan_1.NanoR.html")

#run muxscan function
NanoR::muxscan(muxdata=muxdata,out=out6)
The output HTML file looks like the one below.
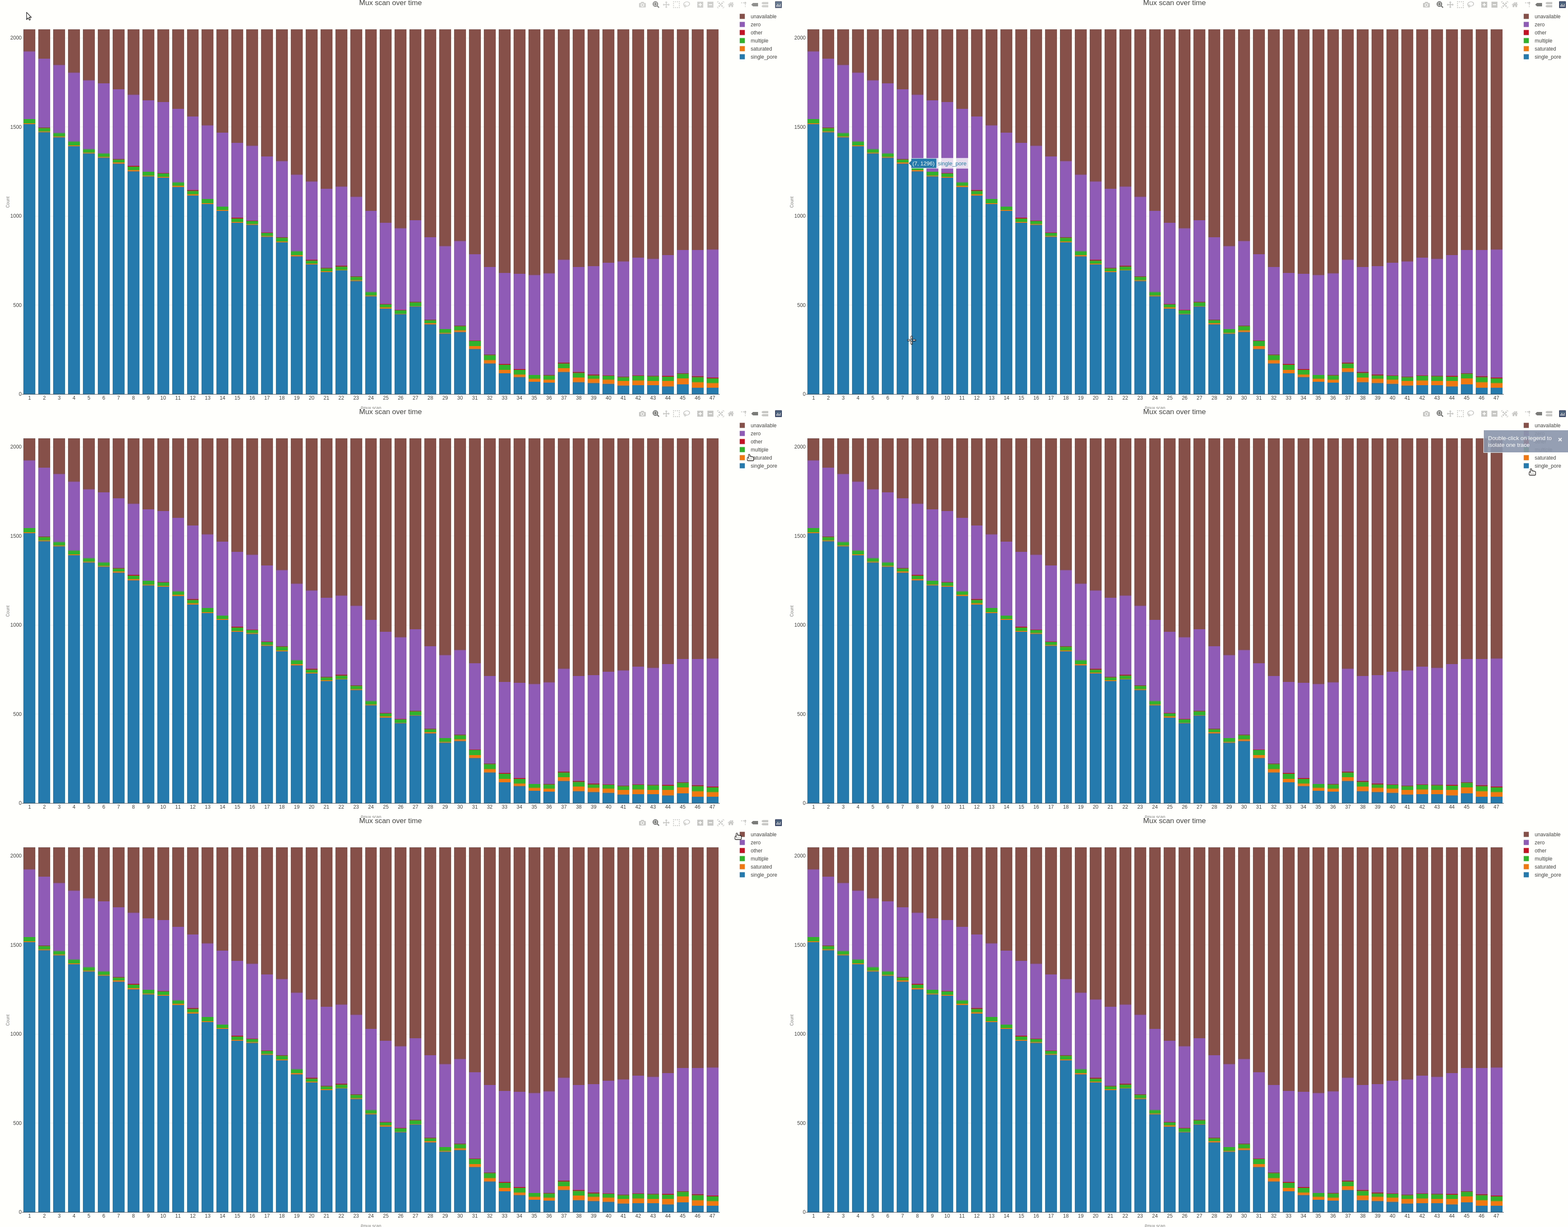
NanoR does not perform alignment itself, which is in turn necessary if, for instance, one wants to have further insights into the error rate of the sequencing run. After alignment, alfred (opens new window) can be use to extract alignment-related statistics
alfred qc -r <ref.fa> -o qc.tsv.gz <align.bam>
zgrep ^ME qc.tsv.gz | cut -f 2- | datamash transpose > alfred.4NanoR.tsv
Those statistics can be further plotted with NanoR using the alfredstats (opens new window) function.
out7<-file.path("~/nanortest/alfredqc_1.NanoR.html")
NanoR::alfredstats(qcdata=alfreddata,out=out7)
The output HTML file looks like the one below.
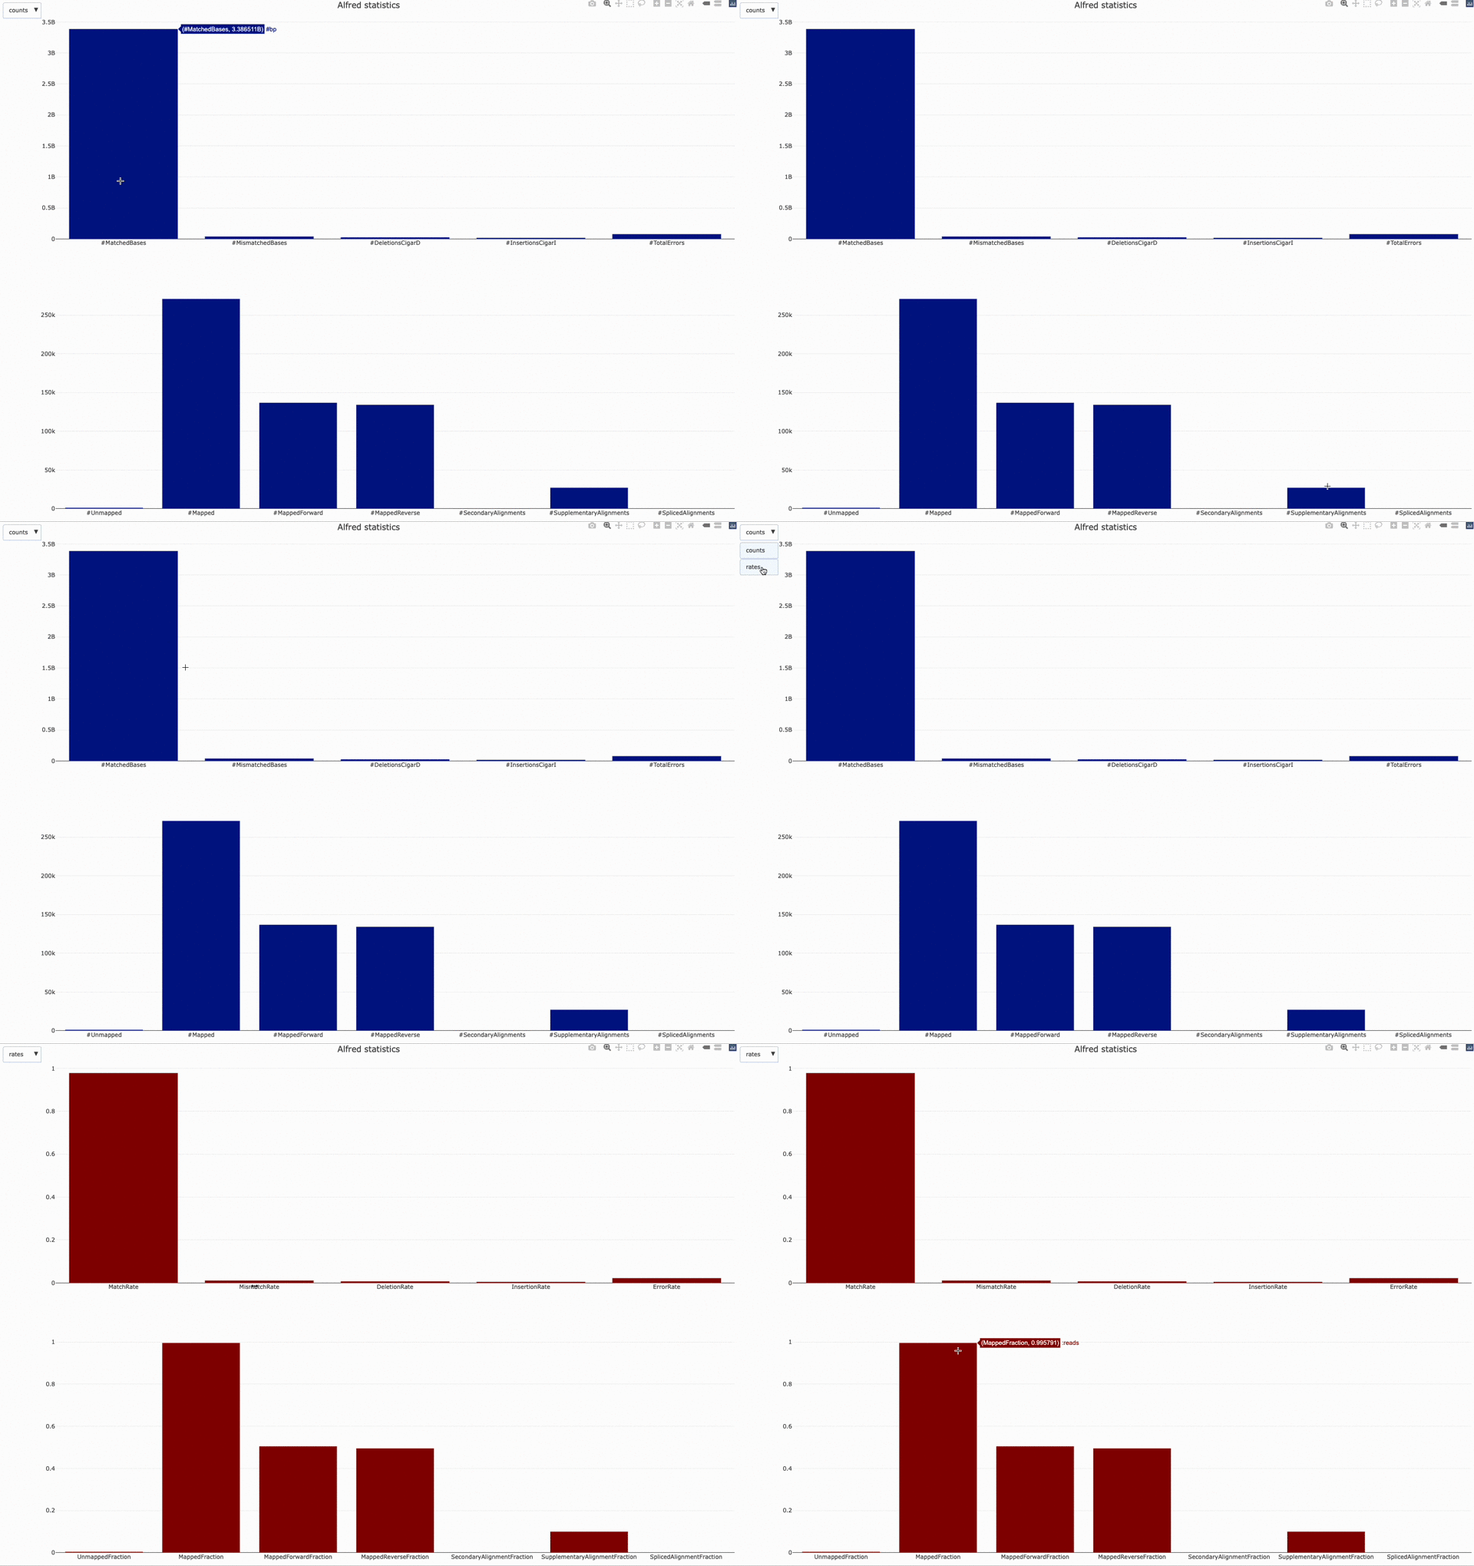
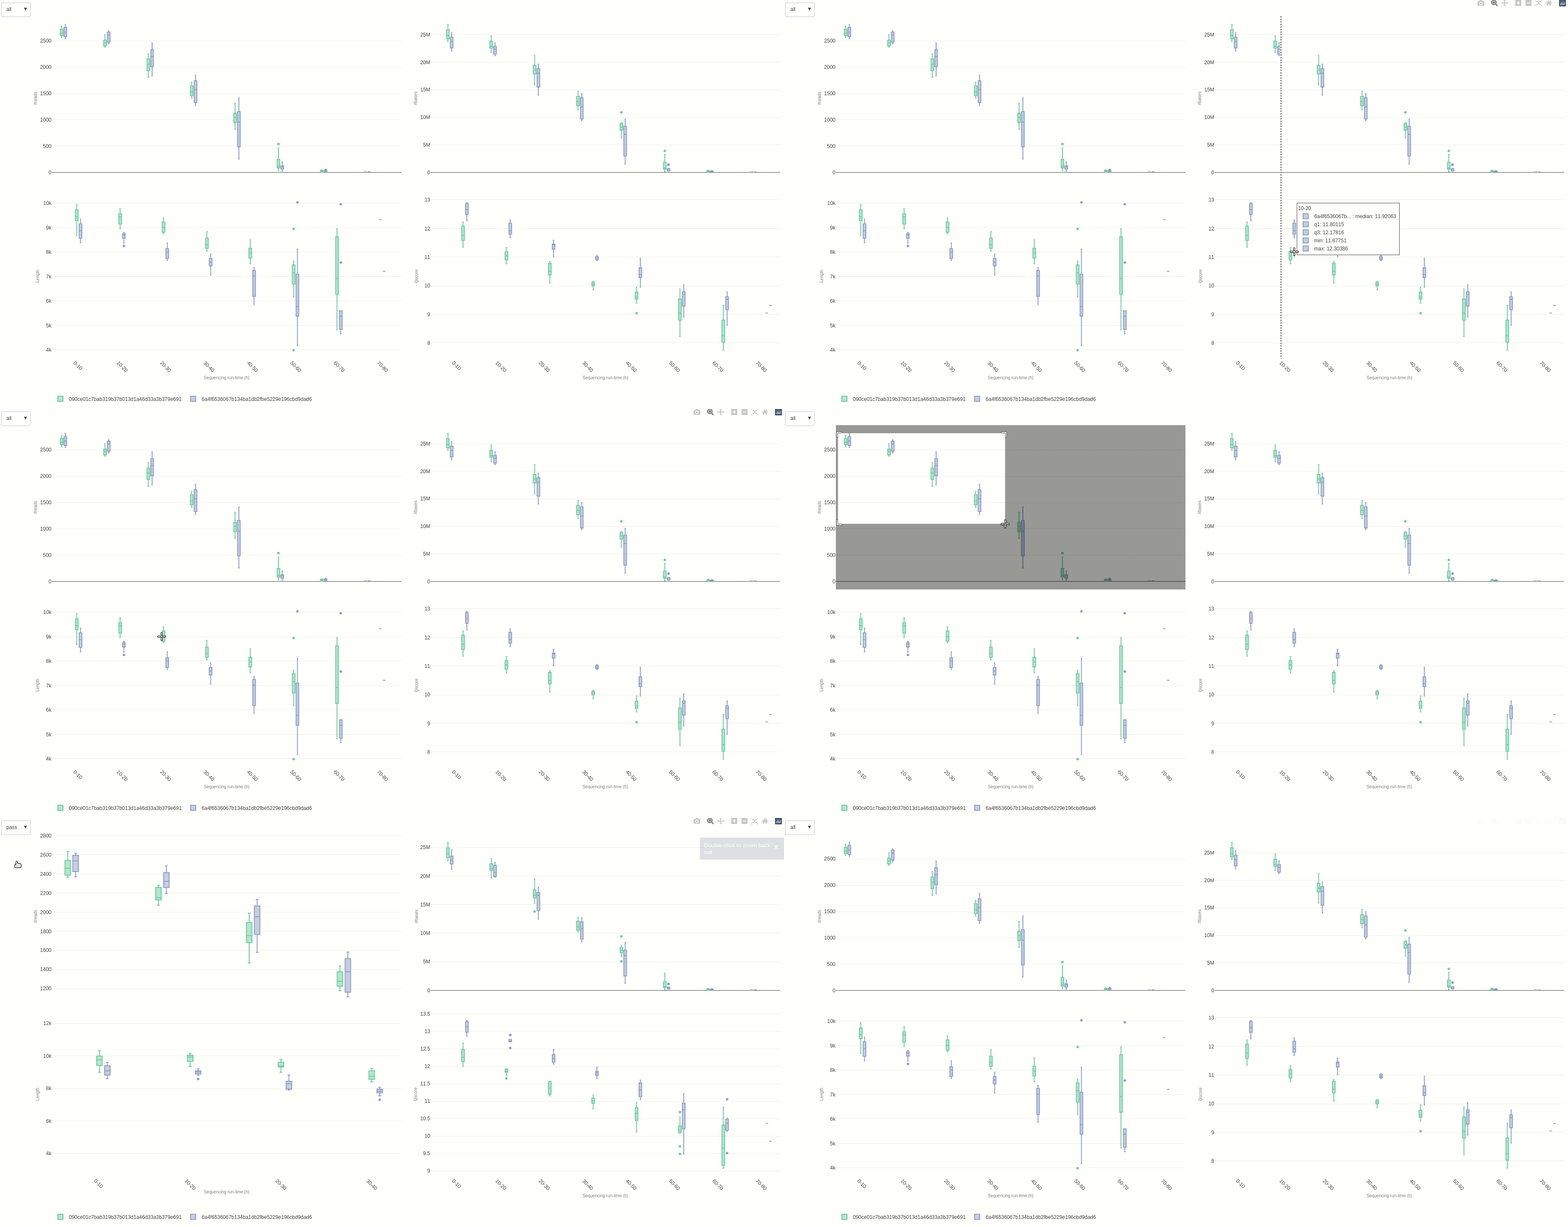
Eventually, a comparison of multiple sequencing run can be done using the compare (opens new window) function.
#out file
out8<-file.path("~/nanortest/comparison_1_2.NanoR.html")

#run compare function
NanoR::compare(summaries=c(summary1,summary2), time=10, out=out7) #time can be adjusted to different hour fractions. Using small intervals is not suggested for readability
The output HTML file looks like the one below.
